What type of metrics are being reported in the ‘Performance’ tab?
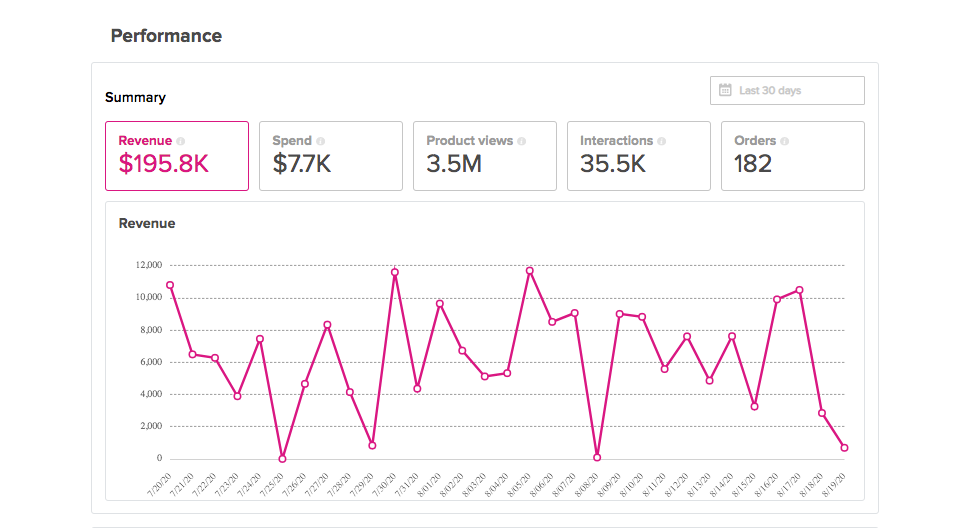
In the 'Performance' tab of the dashboard, you will see two key areas of data, Summary Graph and Details. The metrics you'll see reported are:
Summary:
- Revenue
- Spend
- Product views
- Interactions
- Orders

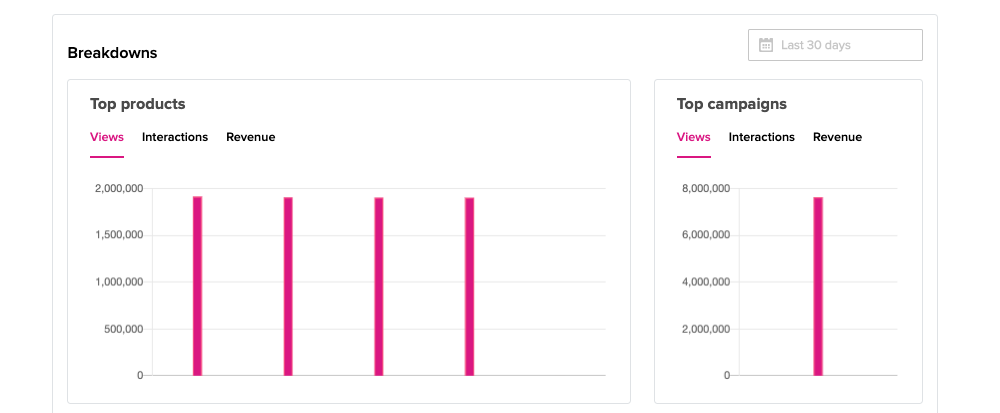
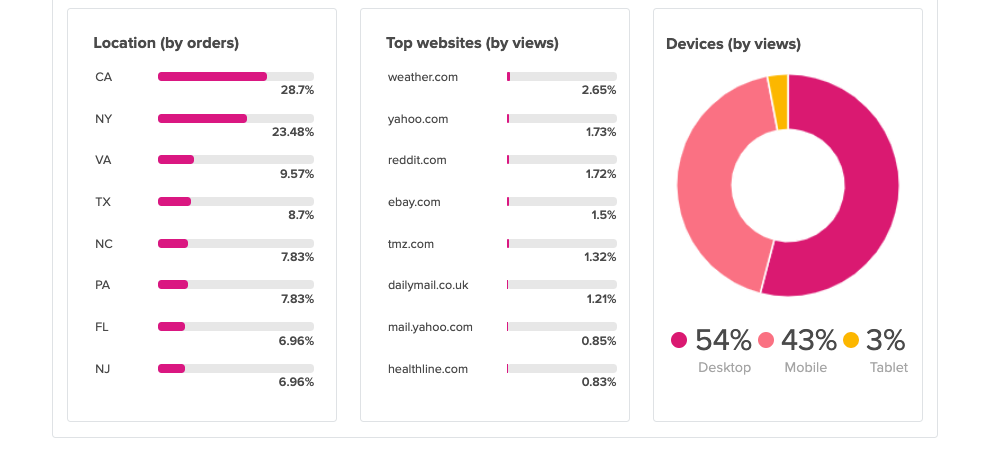
Breakdowns:
- Top products
- Top campaigns
- Top locations
- Top websites
- Devices


Reports:
- Revenue
- Spend
- ROAS
- Product views
- Interactions
- Orders
- Products sold
- New customers
- Average order value
- Avg. days from first touchpoint
- Avg. days from last touchpoint


What does the ‘Average days from first touchpoint’ metric mean?
This is an average of days for all users who have interacted with your ad-unit from first touchpoint to sale.
What does the ‘Average days from last touchpoint’ metric mean?
This is an average of days for all users who have interacted with your ad-unit from last touchpoint to sale.
Why don’t I have any sales?
There could be several reasons your brand hasn’t seen sales yet:
Klickly works with brands of all sizes, but we usually see the best results from brands with more than 30k data points per month. “Data points” may include total site visitors per month, $30k of GMV per month, or other similar metrics. (These data points give us a good baseline of information from which to identify your likeliest potential customers – without data, we can’t predict who is potentially interested in your products and thus, whom to target).
Don’t worry if you’re not there yet! We’re more than happy to work with you as you grow, just don’t expect many sales, if any, out of the gate. For brands under 100k site visitors, it usually takes 30-60 days to find the correct audience and see a positive performance.
What are interactions?
Interactions happen when a potential customer engages with your ads. These interactions might range from ad unit clicks, to mouse-overs, to scrolls through photos, to selection of sizes or colors within our Commerce Modules™. If a consumer has engaged in any way, this is called an “interaction.”
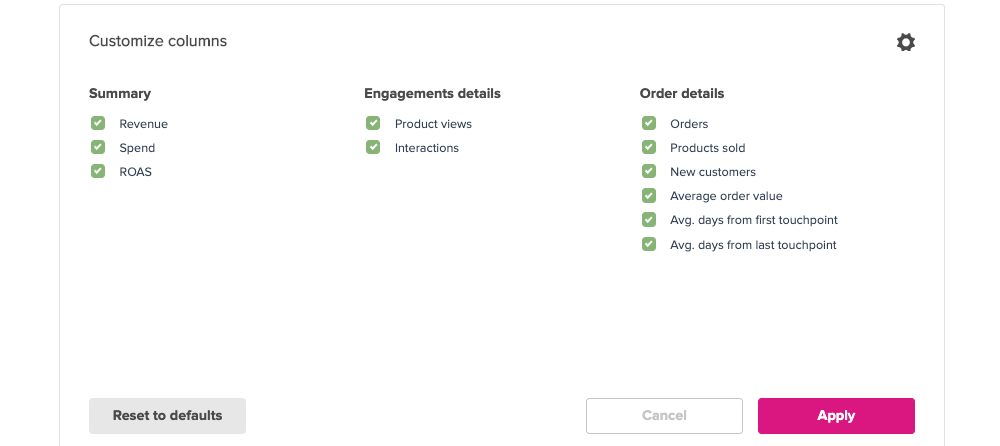
How can I customize the metrics I see on the performance tab?
To customize what metrics you view within the 'Performance' tab:
- Scroll to 'Details'
- Click on the gear icon
- Select or deselect the metrics you'd like to see or not see
- Click ‘Apply’
How do I change the date range in the Performance tab?
To customize the date range for metrics you're viewing:
- Click into the 'Last 30 days' calendar selector
- You can 'Quick Select' the following:
- Last 7 days
- Last 30 days
- Last 12 months
- Week-to-date
- Month-to-date
- Year-to-date
3. You can also select a custom date range
4. The metrics shown will reflect the date range selected