How do I log into the Klickly dashboard?
Use the following steps to log into the Klickly dashboard:
- Go to: https://brands.klickly.com/page/sign-in
- Enter your Email and Password
- You will be taken to your homepage in your dashboard
- Use the tabs at the top to navigate as needed
If you signed up to Klickly through Shopify:
- Go to: https://brands.klickly.com/page/sign-in
- Enter your Shopify store address you signed up with
- You’ll be directed to log into Shopify (if you’re not already)
- You will be taken to the home page of your Klickly dashboard
- Use the tabs at the top to navigate as needed
I forgot my password, how do I request a new one?
If you forgot your password:
1. Go to: https://brands.klickly.com/page/sign-in
2. Click on ‘Forgot Password’ below the login button
3. Enter the email address associated with your Klickly account
4. We will email you a reset link to reset your password
How do I edit my company and user info?
To edit information about your company’s profile or account, simply enter Account settings by clicking on your brand name in the upper right corner in your dashboard. There, you’ll be able to edit and review info on the following:
- Company Info
- Account Management
- Creative Settings
- Invoices
- Tracking
- Customer Management
- Payments
- Notifications
- Integrations
What type of metrics are reported in the dashboard?
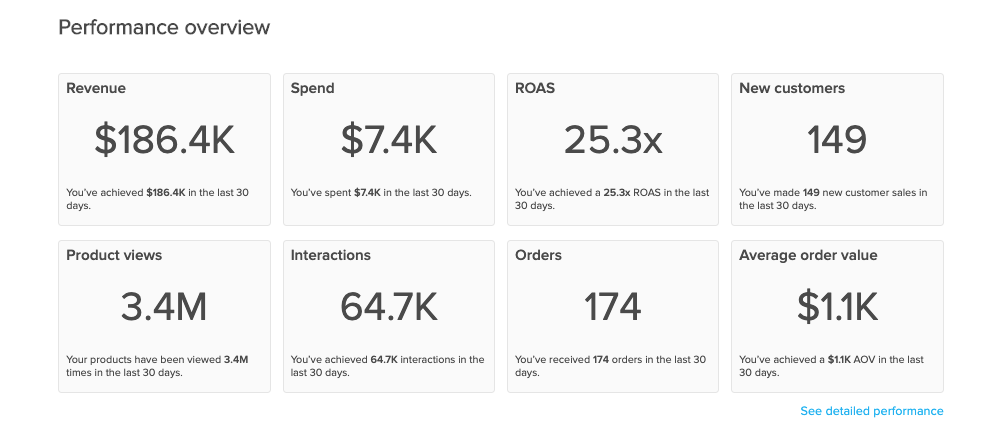
You can see an overview of your metrics on your Home page, as well as more detailed stats within the Performance tab:
Home tab: (default of last 30 days; can be adjusted)
- Revenue: All revenue that Klickly has enabled
- Spend: All commissions you’ve paid and any weekly-charged boosts
- ROAS: Your Klickly-enabled revenue divided by your Klickly spend
- New Customers: The number of first-time purchasers Klickly has driven
- Product Views: The numbers of times your products have been viewed within our Commerce Modules™
- Interactions: The number clicks, mouse-overs, and engagements within our Commerce Modules™
- Orders: The numbers of Klickly-enabled orders
- Average Order Value: The average dollar amount per order Klickly has enabled
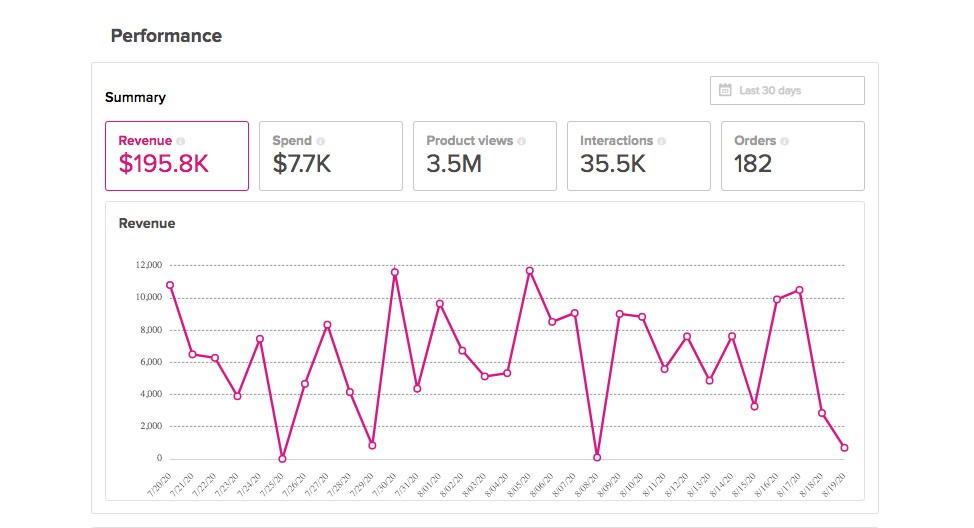
Performance tab:
In the performance tab, you’ll find two sections of reporting, a Summary section and a Details section. (As a note, the default visualization is last 30 days; this can be adjusted)
Summary: the Summary section gives you a line graph to see visual performance of 5 key metrics – toggle between these metrics for a quick overview of the following:
- Revenue: All revenue that Klickly has enabled (click on to see graph)
- Spend: All commissions you’ve paid and any weekly-charged boosts (click on to see graph)
- Product Views: The numbers of times your products have been viewed within our ad-units (click on to see graph)
- Interactions: The number clicks and mouse-overs within our ad-units (click on to see graph)
- Orders: The numbers of Klickly-enabled orders (click on to see graph)
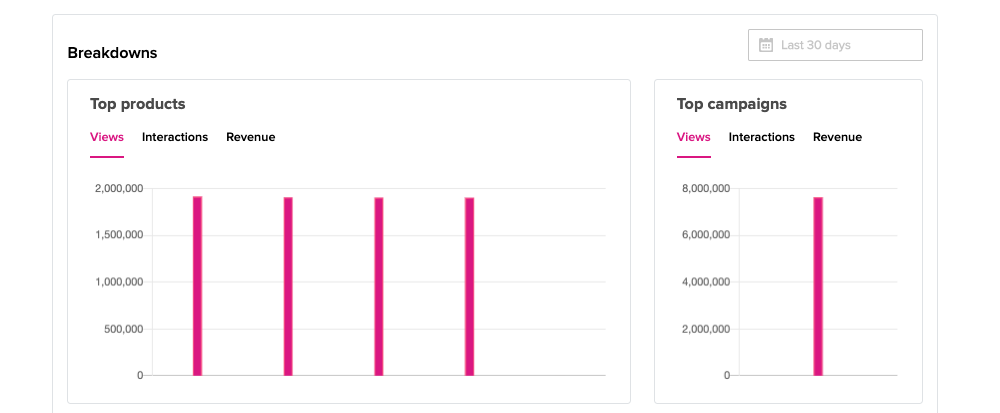
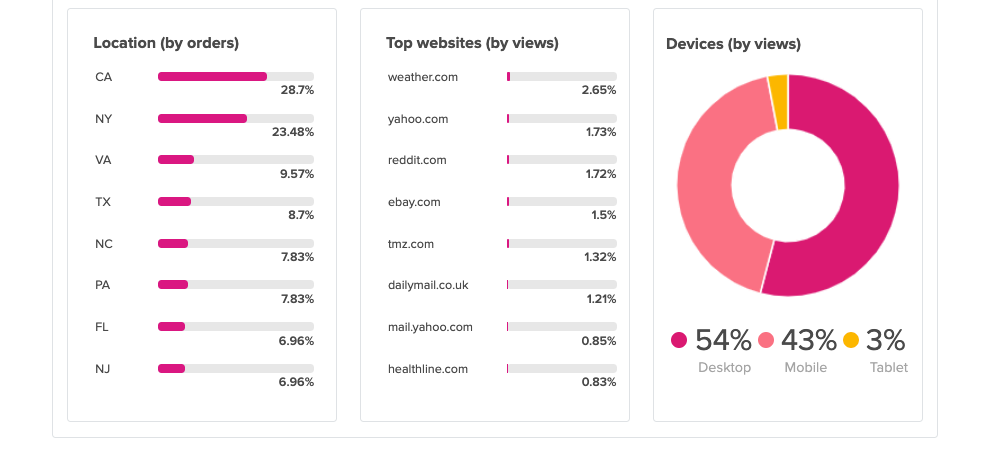
Breakdowns: the Breakdowns tables give you a deeper dive into specific reporting metrics on a more granular level. Here you can see the following:
- Top Products: broken down by views, interactions, and orders
- Top Campaigns: broken down by views, interactions, and orders
- Location: by orders
- Devices: by views
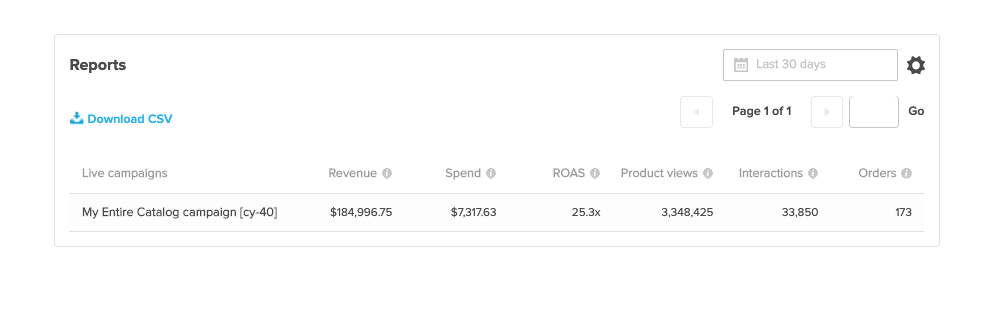
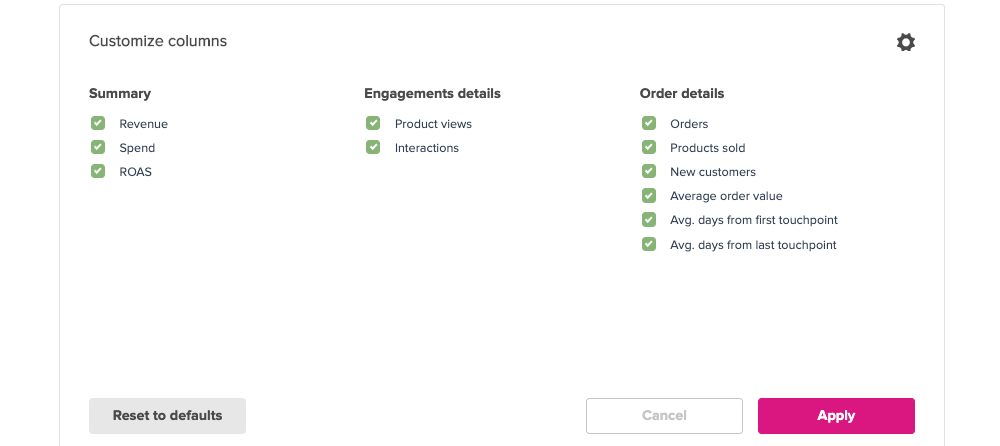
Details: the Details table gives you a deeper dive into specific reporting metrics for each campaign on a more granular level. By selecting the “gear” icon to the right of the Details table, you can customize which data you’d like to view in your campaign reports. (If you wish to only show the default metrics, click ‘Reset to defaults’ to reflect: revenue, spend, ROAS, product views, interactions, orders.)
- Revenue
- Spend
- ROAS
- Product views
- Product interactions
- Orders
- Products sold
- New customers
- Average order value
- Avg. days from first touchpoint
- Avg. days from the last touchpoint
How can I change the date range when viewing metrics in the dashboard?
The date range for metrics defaults to 'last 30 days' in the dashboard. To adjust this date range, simply click on the calendar icon at the top of the page and choose the start date and end date you would like to view – your performance metrics will automatically be updated to reflect this new date range. Alternatively, you can use the quick-select feature to quickly choose a common date range, including Last 7 days, Last 30 days, Last 12 months, Week-to-date, Month-to-date, and Year-to-date.
How long after launching should I review my results in the dashboard?
This is completely up to you! Some brands like to view their dashboard multiple times each day, while others will take advantage of Klickly’s risk-free, auto-adjusting model and only log in every few weeks.
It typically takes a few days for campaigns to scale to initial testing volumes, and a few more days to weeks for sales to start coming in. We recommend checking your dashboard regularly within the first few weeks to ensure everything is set up and performing as expected.